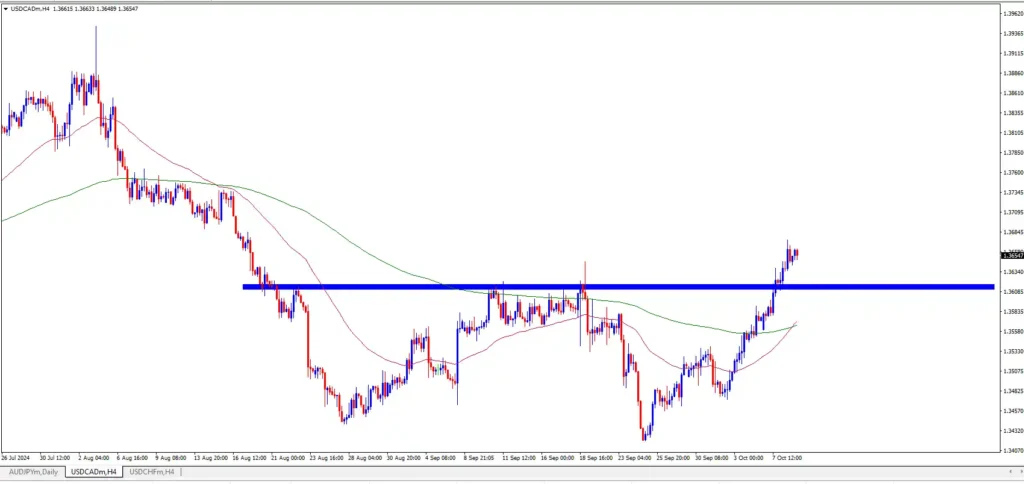
US Dollar vs Canadian Dollar Chart Analysis (October 8, 2024)
USD/CAD has shown strong bullish momentum since the start of October. It is currently hovering around 1.3660, the highest level seen in both September and October.
Key Analysis:

- Resistance Breakthrough: The price has successfully broken through short-term resistance at 1.3620 and remains stable above this level at 1.3660.
- Moving Averages: On the 1-hour timeframe, the 50 EMA is above the 200 EMA, indicating a robust short-term uptrend.
- Resistance Levels: The next short-term resistances are at 1.3695 and 1.3720.
- Support Levels: Key supports are found at 1.3620 and 1.3562.
Us dollar vs Canadian dollar Forecast:
As mentioned in our previous updates, we anticipated USD/CAD would continue its upward trend, which has done just that. We expect the pair to aim for targets at 1.3690 and potentially 1.3735. It’s possible the price may dip to around 1.3625 before reversing and continuing its bullish momentum.
Short-Term Outlook: Bullish
Check out our free forex signal. No registration is required. Click Here
