BTC/USD Daily Chart Analysis
Recently, BTC/USD experienced a dip to an October low of $58,800 but quickly rebounded. Yesterday’s daily candle closed higher at $63,000, indicating recovery momentum. Currently, the price is fluctuating around the $63,000 level. (BTC Price Prediction)
4-Hour Chart Insights

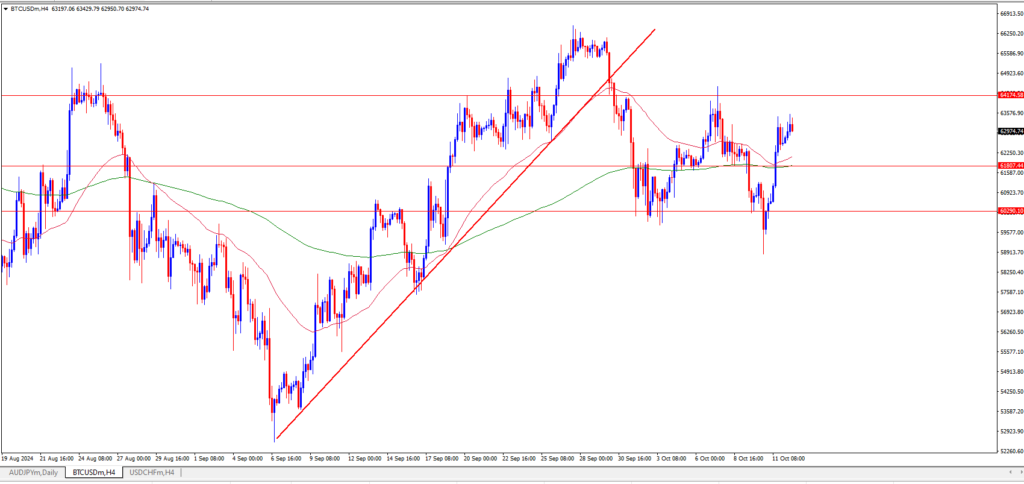
On the 4-hour chart, the 50 EMA and 200 EMA are running parallel without crossing, suggesting a consolidation phase. The price is hovering around these EMAs, indicating a range-bound market condition.
1-Hour Chart Overview
In the 1-hour chart, the 50 EMA has crossed above the 200 EMA, which is a bullish signal. The price holds above both moving averages, suggesting potential upward momentum in the short term.
Support and Resistance Levels
- Short-term Support Levels: $61,800 and $60,290
- Short-term Resistance Level: $64,200
BTC Price Prediction Short-Term:
We anticipate that BTC may push upward toward $64,200 in the coming sessions. If this resistance level is broken and the price stabilizes above it, the next target could be $65,500. However, a pullback to around $62,300 is possible before a bullish move resumes.
On the downside, if the price drops below $61,900 and holds, it may decline further to test support at $61,200 and $60,300.
Overall, our short-term outlook for Bitcoin remains bullish, with price action hinting at a potential move toward higher resistance levels in the coming days.
Check out Our Free Forex Signal. No Registration Required. CLICK HERE
