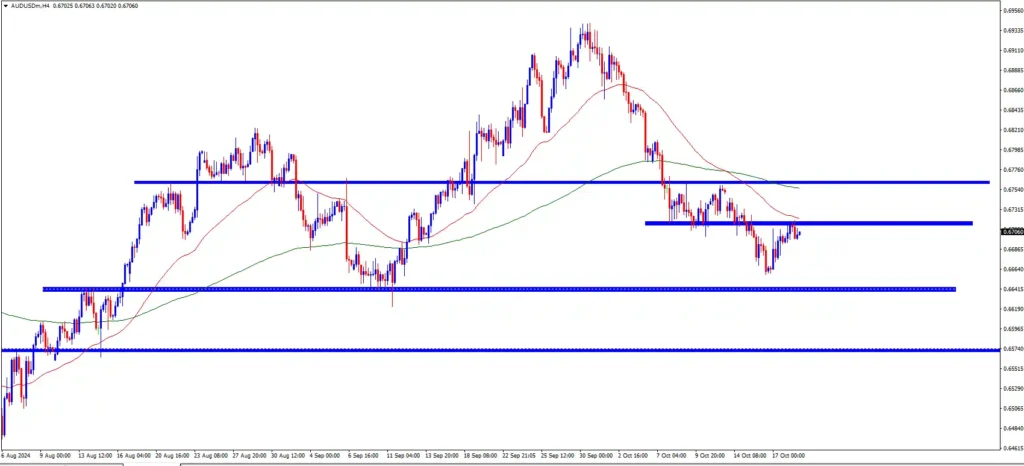
AUD/USD Daily Chart Analysis
Analyzing the daily chart of AUD/USD, we observe that the price recently touched a monthly low at the 0.6650 level. Following this, the price experienced a slight pullback and climbed to the 0.6720 level, closing above the 0.6700 mark on the weekly candle.

In the four-hour timeframe, the price is currently situated near the lower boundary of the 50 EMA. Notably, the 50 EMA has recently crossed below the 200 EMA, indicating a potential continuation of the downtrend for the AUD/USD pair.
Key Levels to Watch
Short-term Resistance:
0.6760
0.6810
Short-term Support:
0.6640
0.6570
AUDUSD Prediction: Our expectation is that the price will maintain a downtrend in the upcoming sessions. The initial downside target is set at 0.6640. If the price manages to stabilize at this level, the next target could be 0.6570. It’s worth noting that the price may retest the 0.6760 level before resuming its downward movement.
Conversely, if the price breaks above 0.6770 and holds at that level, it could potentially rise to the next resistance at 0.6823.
In summary, given the current market context, we are leaning towards a bearish outlook for AUD/USD.
